
Table of contents
Table of contents
- The basics of a PC Windows diagnostics report
- Step-by-step guide to running a PC diagnostics report
- 1: Start with Windows Event Viewer
- 2: Check Windows System Information
- 3: Check Task Manager
- 4: Finish with Windows Performance Monitor
- Take your Windows diagnostics report a step further
Generate summary with AI

Imagine a small business owner noticing their accounting software and web browser are taking unusually long to open or respond, with a few “blue screen of death” errors stopping their progress entirely. Generating a Windows diagnostics report, such as those by tools like System Information (msinfo32), Performance Monitor, or Event Viewer provides a comprehensive overview of a system’s health, configuration changes, and performance bottlenecks, helping pinpoint the exact cause of the instability without resorting to a complete system reinstall immediately.
This guide will help you generate a PC diagnostics report in Windows and review the best tools for the job.
The basics of a PC Windows diagnostics report
A Windows diagnostics report serves as an excellent starting point for troubleshooting because it offers a comprehensive overview of your system’s overall health, configuration, and performance from various angles. A bug or redundancy might get missed by one tool but picked up by another.
For example, Microsoft identified a widespread problem where a specific version of a video driver was causing devices to crash. By analyzing the diagnostic data (which would include crash logs and system event information, similar to what you’d see in the Event Viewer’s System log for Kernel-Power Event ID 41), Microsoft was able to quickly detect this recurring issue affecting many users. They immediately contacted the third-party developer responsible for the video driver and provided an updated driver to Windows Insiders within 24 hours. Then, based on further diagnostic data from these Insiders’ devices, they validated the fix and rolled out the new driver to the general public as an automated update the next day.
Here’s why it’s so valuable:
- Holistic data aggregation: These reports efficiently aggregate diverse types of critical information, including system logs, hardware specifications, and real-time performance metrics like CPU usage, disk storage, and programs booting or shutting down. This centralization means you don’t have to hunt for data across multiple isolated locations.
- Early issue identification: By presenting a consolidated view, the report helps users and technicians quickly identify potential issues that might otherwise remain hidden. It’s designed to bring all problems (small and large) to light as they occur, rather than just waiting for obvious failures.
- Systematic troubleshooting: The detailed data from tools like Event Viewer (for specific problem events) and Performance Monitor (for utilization trends) allows for a systematic approach to diagnostics. You can quickly narrow down the scope of a problem, determining if it stems from hardware malfunctions, software conflicts, or performance bottlenecks, without immediately resorting to more drastic or time-consuming solutions.
- In-depth context: The reports provide crucial context for any issues experienced. For instance, specific error codes or performance spikes can be matched with corresponding system activities, offering immediate clues about the root cause of instability or slowdowns.
» Don’t miss these great driver updater software solutions
Key tools
- Windows Event Viewer: Best for diagnosing specific system errors, crashes, and security events by examining historical logs.
- Windows System Information (msinfo32): Best for quickly obtaining a comprehensive overview of your PC’s hardware and software configuration, especially for compatibility checks.
- Windows Task Manager: Best for quickly identifying and managing real-time resource hogs (CPU, memory, disk) and unresponsive applications.
- Windows Performance Monitor: Best for in-depth, long-term analysis of subtle performance bottlenecks and resource trends using highly granular data.
Step-by-step guide to running a PC diagnostics report
1: Start with Windows Event Viewer
Windows Event Viewer is a fundamental diagnostic tool embedded in the Windows operating system that provides a chronological log of significant events on your computer. These events span a wide range of activities, from successful application launches to critical system failures. It’s often the first place IT professionals look when trying to understand what went wrong with a system.
How it works
Windows Event Viewer works by continuously recording events generated by the operating system, applications, and hardware. Each event is logged with specific details, including the time it occurred, its source (which component or application generated it), an Event ID (a unique number identifying the type of event), and a descriptive message.
It organizes the information into several main logs:
- Application log: Records events from installed applications, such as software errors, crashes, or successful operations.
- Security log: Contains security-related events, including successful and failed login attempts, file access auditing, and privilege changes.
- System log: Provides a good view of PC health, logging events from Windows system components and drivers. This is where you’d find information about startup and shutdown issues, hardware failures, driver problems, and critical system errors.
- Setup log: Records events related to Windows installation, updates, and setup processes.
- Forwarded events: Stores events forwarded from other computers on a network.
This makes it ideal for identifying and analyzing:
- System stability issues: Crashes, unexpected shutdowns, startup failures, or freezes (often found in the System log).
- Application errors: Software malfunctions, application crashes, or features not working correctly (Application log).
- Hardware problems: Driver issues, disk errors, memory faults, or peripheral connection problems (primarily System log but sometimes Application log if hardware impacts software).
- Security incidents: Failed login attempts, unauthorized access attempts, or unusual account activity (Security log).
- Performance bottlenecks: While not a primary performance monitoring tool like Performance Monitor, frequent warnings or errors in the logs can indicate underlying issues that contribute to slowdowns.
How to use Windows Event Viewer
Step 1. Open Windows Event Viewer
- Click the Start button (or press the Windows key)
- Type Event Viewer into the search bar
- Click on “Event Viewer” from the search results

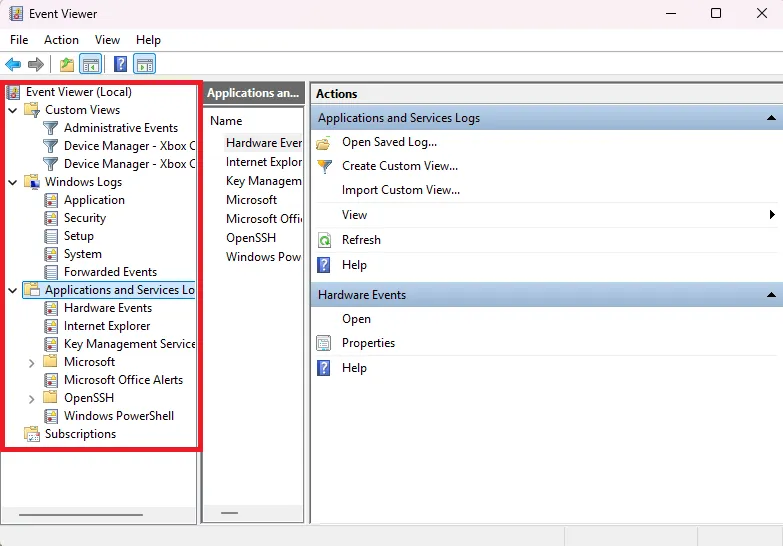
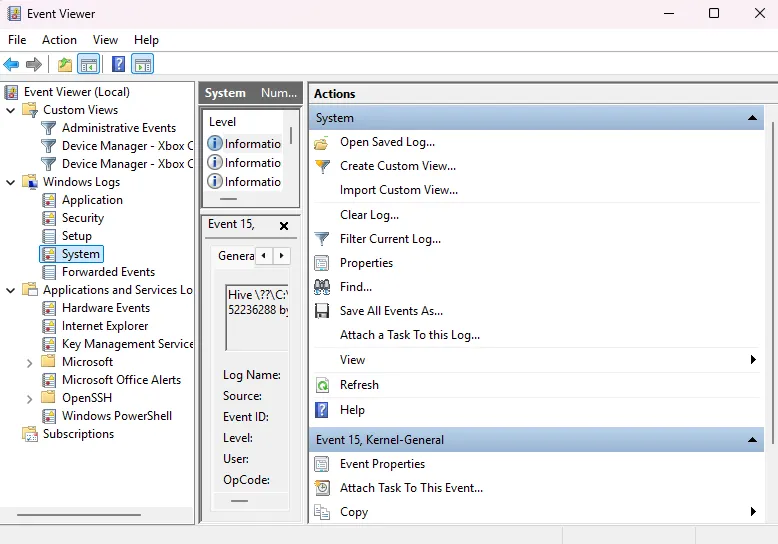
Step 2. Navigate to your chosen log
Once opened, in the left-hand pane, expand “Windows Logs” to see the main log categories, then click on a specific log to view its events in the center pane.
Step 3. Filter events
This step is crucial for troubleshooting issues. With a log selected, click “Filter Current Log” in the right-hand pane.

From here, you can refine your view by:
- Logged: Specify a time range (e.g., “Last 24 hours,” “Last 7 days,” or a custom range).
- Event level: Select “Informational,” “Warning,” “Error,” “Critical,” or “Verbose.” For troubleshooting issues, focusing on “Error” and “Critical” is often the most productive starting point.
- Event IDs: Search for specific Event IDs if you know them.
- Keywords: You can use the “Search” function to look for specific text within the logs, which is highly useful when trying to pinpoint issues around what you are experiencing. For example, if your machine keeps rebooting, you can filter or search for events related to system shutdowns or reboots.

Step 4. Interpret the findings
The first step to understanding the findings from an event log involves assessing the date and time it occurred, then the threat level, which includes:
- Critical: Indicates a severe problem that might cause system instability or failure. Requires immediate attention.
- Error: A significant problem occurred, possibly leading to loss of data or functionality. Needs investigation.
- Warning: An issue that doesn’t immediately affect functionality but could indicate potential future problems or an abnormal condition (e.g., low disk space or a service failed to start but later recovered).
- Information: Successful operations or general system activities. Most events fall into this category and are usually not a concern.
- Verbose: Highly detailed diagnostic information, typically used by developers or IT professionals for deep troubleshooting.
Other key findings include:
- Source: The application, service, or component that generated the event (e.g., disk, Service Control Manager, application error, Windows update). This helps pinpoint where the problem originated.
- Event ID: A unique numerical identifier for the event. This ID is incredibly valuable as it can be used in search engines (e.g., “Event ID 6008 Windows”) to find Microsoft documentation, forums, or community solutions related to that specific error.
- Task category: Provides additional context about the event within its source (e.g., shutdown, log on/log off).
- General/details tab: The “general” tab offers a human-readable description of the event. The “details” tab provides more technical information, often in XML format, which can be useful for advanced users or when troubleshooting with support.
Please note: While Event Viewer logs performance-related events (like low disk space warnings), it’s not designed for real-time performance monitoring or detailed metrics like CPU/RAM utilization over time. It also doesn’t correlate them across different logs or provide a direct “cause-and-effect” explanation without manual analysis.
Example Interpretation
If your machine keeps rebooting, you might look in the System Log for Error or Critical events. Finding Event ID 6008 (unexpected shutdown) often indicates a system crash, while Event ID 6006 (clean shutdown) indicates a normal reboot. Seeing 6008 without user interaction points to an issue, and you’d then look at events immediately following it (especially those marked Error or Critical) for clues about the root cause. It could be a specific driver failure, a disk error, or even a power issue.
2: Check Windows System Information
The Windows System Information tool (msinfo32.exe) provides a static, yet comprehensive, overview of your computer’s hardware, system components, and software environment. Unlike real-time monitoring tools, msinfo32 gathers detailed configuration data.
How it works
System Information works by compiling a detailed inventory of your PC’s configuration. It queries various parts of your operating system, hardware, and software environment through Windows Management Instrumentation (WMI) to present a structured, tree-like view of this data.
This makes it ideal for identifying and analyzing:
- Hardware compatibility: Its primary strength lies in providing a clear snapshot of your installed hardware, making it easy to determine if your machine meets the requirements for a software deployment update, a new application, or a Windows operating system upgrade. This includes details on your processor, RAM, motherboard, BIOS version, and more.
- System overview: It gives a useful overview of the PC, including crucial items of interest like the operating system type (e.g., Windows 10 Pro 64-bit), build number, installed hardware, and system model.
- Driver information: You can view detailed information about installed drivers, including their versions and paths, which can be helpful in identifying outdated or problematic drivers (though it doesn’t flag them directly like Device Manager).
- Software environment: Provides insights into running tasks, loaded modules, services, and startup programs, which can indirectly aid in troubleshooting software conflicts.
- Troubleshooting hardware conflicts (indirectly): While not a direct “troubleshooter” for conflicts, by listing resource usage (IRQs, DMA, I/O addresses), it can provide data that an IT professional might use to diagnose conflicts if two devices are trying to use the same resources.
How to use System Information
Step 1. Open System Information
- Click the Start button (or press the Windows key)
- Type System Information into the search bar
- Click on “System Information” from the search results to open the application

Step 2. Navigate the System Information Window
Once opened, you’ll see a tree structure in the left-hand pane. The initial view is “System Summary,” which provides high-level details about your PC.

From here, you can expand categories like “Hardware Resources,” “Components,” and “Software Environment” to drill down into specific details (e.g., “Display” under “Components” for graphics card information or “Memory” under “Hardware Resources” for RAM details).

You can also use the “Find” feature (Ctrl + F) to quickly search for specific keywords like “video card,” “network adapter,” or “driver version.”

Step 3. Interpret the findings
The most comprehensive section to look at is System Summary, which provides the most critical high-level information, including:
- OS name & version: Confirms your Windows operating system and its specific build (e.g., “Microsoft Windows 11 Pro,” “Version 10.0.22621 Build 22621”). This is vital for software compatibility checks.
- System type: Identifies if your system is 64-bit or 32-bit (e.g., “x64-based PC”), crucial for software installation.
- Processor: Details your CPU model and speed, essential for understanding processing power.
- Installed physical memory (RAM): Shows the total amount of RAM, key for determining if you have enough memory for demanding applications or upgrades.
- BIOS version/date: Provides information about your firmware, useful for checking if you have the latest BIOS version.
- System manufacturer/model: Helps identify your specific computer model, useful for finding drivers or support.
Next, check Components to get detailed information on various hardware devices, including:
- Display: Graphics card model, driver version, resolution.
- Network adapter: Network card details, driver, MAC address.
- Storage (disks, drives): Hard drive/SSD models, sizes, partition information.
- Sound device: Audio chip and driver details.
- USB: Lists connected USB devices and controllers.
Finally, check Software Environment for information about currently installed programs and tasks:
- System drivers: Lists all loaded and unloaded device drivers, including their versions and statuses.
- Startup programs: Shows programs that launch with Windows, which can sometimes impact boot time or overall performance and should be disabled if not necessary.
- Running tasks: Provides a snapshot of currently running processes.
Please note: Like Event Viewer, System Information provides a snapshot of your system’s configuration, not real-time performance data, and won’t show you current CPU usage or memory consumption dynamically. It also doesn’t diagnose problems or offer solutions directly. You’ll need to interpret the information and often cross-reference it with other diagnostic tools or online resources.
3: Check Task Manager
The Task Manager is a powerful utility built into Windows that provides a real-time snapshot of your computer’s performance, running applications, background processes, and resource utilization. It’s often the go-to tool for quickly identifying and addressing immediate performance issues or unresponsive programs.
How it works
Task Manager works by continuously monitoring and displaying data about your system’s resource consumption. It polls the operating system for information about currently running processes, their resource usage, and overall system performance metrics.
This makes it ideal for interpreting and analyzing:
- Sudden performance drops: When your computer becomes sluggish, Task Manager provides an immediate snapshot of what’s consuming resources.
- Unresponsive applications: If a program is frozen or “not responding,” Task Manager allows you to identify and force-close it.
- Network activity: The “Performance” tab and “Processes” tab can show current network usage, useful for identifying applications that might be consuming excessive bandwidth.
» Struggling to diagnose network issues? Here’s how to master IPConfig commands for network troubleshooting
How to use Task Manager
Step 1. Open Task Manager
The fastest way to open Task Manager is with the keyboard shortcut. Press CTRL + Shift + Esc.
Step 2. Navigate Task Manager
When you first open Task Manager, you might see a simplified view. Click “More details” (usually at the bottom left) to expand it and reveal all the tabs.

The main tabs for diagnostics include:
- Processes: This is where you’ll spend most of your time. It lists all running applications, background processes, and Windows processes. You can click on the column headers (e.g., “CPU,” “Memory,” “Disk,” “Network”) to sort processes by their resource consumption, helping you quickly identify resource hogs. To end an unresponsive process, select the process name, then click “End task”, or right-click the process and select “End task”.
- Performance: Provides real-time graphs and statistics for your CPU, Memory, Disk, and Network utilization. This tab is excellent for getting a visual overview of how busy your system components are.
- App history: Shows resource usage over time for Universal Windows Platform (UWP) apps from the Microsoft Store.
- Startup: Lists programs configured to run when Windows starts, along with their “Startup impact.” You can right-click and “Disable” unnecessary items to improve boot times.
- Users: Shows resource usage per user logged into the system. More effective in business environments with multiple users per system.
- Details: Offers a more technical, detailed view of all running processes, including their Process ID (PID), user name, and various other attributes.
- Services: Lists all services running on your system. You can start, stop, or restart services from here, though caution is advised as stopping critical services can cause system instability.
Step 3. Interpret the findings
The Processes Tab is the first key area to review potential problems. Sort by the highest usage in each of these key areas to identify which processes are hogging resources:
- CPU: Percentage of processor time being used by each process. High CPU usage (consistently above 80-90% for a single process or 100% total) often indicates a problem or an intensive application running.
- Memory: Amount of RAM (in MB or GB) each process is currently using. High memory usage can lead to system slowdowns and “out of memory” errors if your total RAM is insufficient. Pro tip: Search engines like Google Chrome can be extremely RAM intensive, especially with multiple tabs open.
- Disk: Read/write activity of each process to your storage drive. High disk activity can slow down your entire system, especially if it’s a traditional spinning HDD. Solid-state drives (SSDs) are usually more efficient and effective.
- Network: Amount of network bandwidth being used by each process. Useful if you suspect an application is using too much internet data, either through poor optimization or malicious activity that might indicate malware or other viruses.
- “Status” column: Shows if an application is “Not responding,” which is a clear indicator it needs to be ended.
» Here are the best portable SSDs for IT departments

Please note: The most significant risk is ending a critical Windows process (like explorer.exe, svchost.exe, or System). Doing so can lead to an unresponsive desktop, system instability, a forced reboot, or even data loss if unsaved work is open. Always research an unfamiliar process before ending it.
Next, the performance tab can show you resource utilization over time, which might indicate problems not currently showing on real-time utilization data. They include:
- CPU graph: Shows overall CPU utilization over time. Spikes indicate demanding tasks that should be reviewed.
- Memory graph: Displays RAM usage. A consistently high percentage (e.g., 90%+) suggests your system might be short on RAM or has a memory leak.
- Disk graph: Shows read/write activity on your drives. Consistent 100% usage often points to a bottleneck and could indicate failing hardware.
- Network graph: Visualizes network activity (e.g., Wi-Fi, Ethernet).
Look for sustained high utilization (above 80-90%) in any of these graphs, as this indicates a bottleneck. If one resource is consistently maxed out, it’s limiting the performance of other components.
4: Finish with Windows Performance Monitor
Windows Performance Monitor is an advanced system diagnostic tool that provides granular, real-time, and historical data about your computer’s hardware and software performance. It operates on the principle of “counters” and “instances” to gather very specific metrics such as % processor time, available RAM, and network interface bytes total per second, making it the go-to utility for IT engineers to truly dig into performance issues and identify bottlenecks that might be missed by simpler tools.
How it works
Performance Monitor works by collecting data from various system components, services, and applications through “performance counters”. Each counter represents a specific metric (e.g., percentage of processor time, available memory, disk queue length). For many counters, there are also “instances” that allow you to monitor that metric for a specific component if multiple exist (e.g., separate instances for each CPU core, each physical disk, or each running process).
The tool can display this data in real-time graphs, histograms, or reports. More powerfully, it can create “Data Collector Sets” to log performance data over extended periods, which is crucial for analyzing intermittent problems or long-term trends.
This makes it ideal for interpreting and analyzing:
- Deep performance bottlenecks: Pinpointing precisely whether a slowdown is due to CPU, memory, disk I/O, or network congestion at a very granular level.
- Resource exhaustion over time: Detecting memory leaks in applications, consistent disk bottlenecks, or network saturation that builds up over hours or days.
- Specific component issues: Analyzing individual CPU core utilization, I/O performance of specific hard drives, or network throughput for a particular adapter.
- Application-specific performance: Monitoring resource usage for individual applications or services to identify those causing problems.
- System responsiveness: Understanding why applications might be hanging or why the system feels sluggish during specific tasks.
- Capacity planning: Collecting long-term data to assess resource needs for future upgrades or system expansion.
» See our picks for the best PC performance monitoring software
How to use Windows Performance Monitor
Step 1. Open Performance Monitor
- Click the Start button (or press the Windows key)
- Type Performance Monitor into the search bar
- Click on “Performance Monitor” from the search results to open it

Step 2. Add counters and monitor performance
Once Performance Monitor is open, in the left-hand pane, navigate to “Monitoring Tools” > “Performance Monitor.” The main view will show a real-time graph (usually displaying “% Processor Time” by default).

To add more counters, click the green “+” symbol (or Ctrl + I) on the toolbar above the graph. In the “Add Counters” dialog box:
- Under “Available counters,” you’ll see a list of categories (e.g., Processor, Memory, PhysicalDisk, Network Interface)
- Expand a category
- Select a specific counter (e.g., Network Adapter)
- Below that, under “Instances of selected object,” choose the specific instance you want to monitor (e.g., _Total for overall, or 0, 1, etc., for individual CPU cores). If there are no instances, this section will be grayed out
- Click “Add >>” to move the selected counter(s) to the “Added counters” list
- Repeat to add multiple counters from different categories
- Click “OK” when you’ve added all desired counters

Step 3. Interpret the results
Performance Monitor primarily produces real-time graphs and can also generate logged reports (called Data Collector Sets) for historical analysis. To understand the graph, here are the key points you need to know:
- Graph lines: Each added counter is represented by a unique colored line on the graph. The legend below the graph identifies each line by its counter name, instance, and color.
- Values (Y-axis): The vertical axis represents the value of the counter (e.g., percentage, megabytes, queue length).
- Time (X-axis): The horizontal axis represents time, showing the trend of the counter’s value over the displayed period.
- Highlighting: You can select a counter in the legend to highlight its line on the graph, making it easier to track.
- Properties: Right-clicking the graph and selecting “Properties” allows you to adjust scales, colors, and the update interval.

Once you understand how to read the graphs, here are the main counters you’ll want to look at:
- Processor\% Processor Time (Instance: _Total): This shows overall CPU utilization. A high value (sustained > 80-90%) indicates a CPU bottleneck where the system is struggling to process tasks, leading to slowdowns. Look into Task Manager to identify specific processes or use other CPU-related counters.
- Memory\Available MBytes: This shows the amount of physical memory (RAM) currently available. A low value (consistently < 100-200MB) indicates a RAM bottleneck where the system is constantly swapping data to disk, causing slowdowns. This could be due to memory leaks or insufficient RAM.
- PhysicalDisk\% Disk Time (Instance: _Total or specific drive letter): This shows the percentage of time the disk is busy with read/write requests. A high value (sustained > 80-90%, especially 100%) indicates a disk I/O bottleneck. Your hard drive/SSD is struggling to keep up with data requests, a very common cause of general system sluggishness.
- PhysicalDisk\Avg. Disk Queue Length: This shows the average number of read/write requests waiting to be processed by the disk. A high value (consistently > 2 for a single disk) indicates that the disk is overloaded and cannot process requests fast enough. It correlates with high % Disk Time.
- Network Interface\Bytes Total/sec: This shows total bytes sent and received per second over a network adapter. A high value (approaching network adapter’s max speed) indicates a network bottleneck. Useful for diagnosing slow internet or network file transfers.
The power of Performance Monitor comes from observing trends. A single spike might be normal, but sustained high values across relevant counters point to a consistent problem. By adding multiple related counters, IT engineers can often deduce the root cause.
For example, high disk queue length and high % Disk Time indicates a disk bottleneck, or a gradual decline in Available MBytes over hours indicates a memory leak.
Take your Windows diagnostics report a step further
If traditional built-in Windows tools aren’t getting the job done, more comprehensive 3rd-party options can help you with PC troubleshooting, managing and maintaining the health of multiple machines in enterprises, small businesses, or IT service providers.
Atera’s RMM platform goes beyond reactive, on-demand diagnostics by enabling proactive, centralized, and automated system health monitoring across an entire network of devices. Unlike running msinfo32 manually on each machine, Atera continuously collects critical diagnostic data in the background from all connected endpoints.
Here’s how Atera’s Autonomous IT diagnostic capabilities give you the upper hand over traditional strategies:
- Continuous, proactive monitoring for AI-powered prevention: Instead of waiting for a user to report a slowdown or error, Atera actively monitors key performance indicators (CPU, RAM, disk, network, services, event logs) in real-time. It can automatically trigger alerts when predefined thresholds are breached, notifying IT professionals of potential issues before they impact end-users. This capability is further enhanced by the Robin, which leverages AI to proactively predict and prevent issues by identifying patterns that might lead to future problems and can initiate automated remediation actions.
- Centralized overview and reporting: For IT teams managing dozens or hundreds of PCs, Atera provides a unified dashboard showing the health status of all devices. This means you don’t need to log into each machine individually to check its Event Viewer or Performance Monitor; all aggregated diagnostic data is accessible from a single pane of glass. Atera’s AI Copilot acts as an intelligent assistant, analyzing complex diagnostic data, alerts, and log entries. It can provide instant insights, suggest optimal troubleshooting steps, and even generate command-line instructions or scripts, drastically accelerating the diagnostic process for technicians.
- Automated diagnostics and remediation: Atera allows for the creation of automated scripts and policies from natural language queries that can perform diagnostic checks, collect logs, and even attempt automated fixes in response to specific alerts. For instance, if too many processes tanks your PC performance, you can ask the AI Copilot a query like “write me a script to flag instances when CPU usage rises above 80%”. The Copilot can then be configured to pull relevant log data and attempt to cut non-critical services immediately, minimizing downtime without human intervention.
- Comprehensive hardware and software inventory: Atera continuously updates a detailed inventory of all hardware components and installed software on each managed device. This goes far beyond the static snapshot of msinfo32 by providing a live, searchable database that’s invaluable for checking compatibility, managing licenses, and understanding a system’s full configuration remotely.
- Remote access and direct troubleshooting: When an issue requires deeper investigation, Atera provides secure, built-in remote access tools. This allows IT professionals to directly connect to a user’s machine, run diagnostic tools, access files, or apply fixes as if they were physically present, drastically reducing resolution times.
- Historical data collection and performance trending: While Windows Performance Monitor can log data locally, Atera collects and stores historical performance data centrally. This allows IT teams to analyze long-term performance trends, diagnose intermittent problems that don’t occur during a brief manual check, and perform capacity planning based on actual usage patterns.
For example, SWNS Media Group used Atera’s AI-powered script generator to dramatically reduce their time to resolution by providing instant scripts for problems and eliminating the need to comb through logs of diagnostic data for solutions.
» Interested? Start a free trial with Atera or contact sales
Related Articles

How to check if a disk is MBR or GPT in Windows
Choosing between MBR and GPT depends on your hardware and future storage needs, with GPT supporting larger drives and modern security features. You can check your disk’s partition style in seconds using Disk Management, Command Prompt, or PowerShell.
Read now
How to enable or disable the Action Center in Windows 10 and 11
The Action Center centralizes system alerts and quick toggles, but it requires specific background services and shell integrations to function correctly. While hiding the interface stops visual distractions, notifications still process in the background, making proactive management necessary for security.
Read now
How to change file associations in Windows 10 and 11
Windows file associations follow a priority system that decides which app opens your files, and problems usually happen when those links break or apps aren’t registered correctly. You can fix or change them using built-in tools, while automation platforms make large-scale management much easier.
Read now
How to fix the “vcruntime140.dll not found” error in Windows 11
The "vcruntime140.dll" error usually happens because of missing or corrupt Visual C++ Redistributables. To fix it safely, verify your system architecture and reinstall the official Microsoft packages for both x86 and x64.
Read nowEndless IT possibilities
Boost your productivity with Atera’s intuitive, centralized all-in-one platform